Demand Estimation
- Population Projection
- Estimate of future land use activities that generate SW (like multistory buildings, commercial activities, hospitals, industries, IT industries etc)
- Define the per capita waste generation parameters
- Estimate waste quantity in each year up to design year (MT)
- Estimate the infrastructure requirements for different MSWM Components after adjusting suitable technical options
Population Projection
Input Requirement |
Data Source |
Remarks |
Master plan report/ CDP/Projections on growth trend if not available from the past data) |
Adopt from available projections from development authority/any other agency |
Estimation of Future Population for Hapur |
||||||||||
Year |
Census Population |
Arithmetical Progression |
Incremental increase Method |
Geometrical Increase Method |
||||||
Increase |
Average Increase |
Projected Population |
Incremental increase |
Average Incremental increase |
Projected Population |
Rate of Growth |
Geometric Average Rate of Growth |
Projected Population |
||
1951 |
49,260 |
|
|
|
|
|
|
|
|
|
1961 |
55,248 |
5,988 |
|
|
|
|
|
0.12 |
|
|
1971 |
71,266 |
16,018 |
|
|
10,030 |
|
|
0.29 |
|
|
1981 |
102,837 |
31,571 |
|
|
15,553 |
|
|
0.44 |
|
|
1991 |
146,262 |
43,425 |
|
|
11,854 |
|
|
0.42 |
|
|
2001 |
211,983 |
65,721 |
|
|
22,296 |
|
|
0.45 |
|
|
|
|
|
32,545 |
|
|
14,933 |
|
|
0.31 |
|
2011 |
|
|
|
244,528 |
|
|
259,461 |
|
|
278,148 |
2021 |
|
|
|
277,072 |
|
|
321,872 |
|
|
364,966 |
2026 |
|
|
|
293,345 |
|
|
358,677 |
|
|
418,061 |
2031 |
|
|
|
309,617 |
|
|
399,216 |
|
|
478,881 |
2041 |
|
|
|
342,161 |
|
|
491,494 |
|
|
628,352 |
Estimate of future land use activities that generate SW
Input Requirement |
Data Source |
Remarks |
Master plan report/ CDP |
Adopt from availble projections from development authority/any other agency |
Define the per capita waste generation parameters
Input Requirement |
Data Source |
Remarks |
Primary analysis on the basis of previous results |
Adopt from available projections from development authority/any other agency |
Present total generated waste/ population in each category |
Average per capita from household (from actual survey conducted) |
325.29 grams |
for commercial waste |
97.59. grams |
for road sweeping waste |
65.06 grams |
for industrial (non-hazardous) and institutional waste |
58.55 grams |
Total |
546.49 grams |
Residential refuse : 0.3 to 0.6 kg/cap/day
Commercial refuse : 0.1 to 0.2 kg/cap/day
Street sweepings : 0.05 to 0.2 kg/cap/day
Institutional refuse : 0.05 to 0.2 kg/cap/day
Estimate waste quantity in each year up to design year (MT)
Input Requirement |
Data Source |
Remarks |
Designing |
Designing |
Per capita quantity X population (for each year) |
Add 1.4% per annum as waste incremant/year |
Year |
GNN |
Other areas |
Total GDA |
Per capita
waste |
Waste From GNN Area |
From Outer Areas |
Total GDA |
Nos. |
Kg |
MT/d |
|||||
2001 |
968,521 |
358,809 |
1,327,330 |
- |
- |
- |
- |
2009 |
1,359,383 |
495,776 |
1,855,159 |
0.55 |
748 |
273 |
1020 |
2011 |
1,479,619 |
537,501 |
2,017,120 |
0.57 |
837 |
304 |
1141 |
2016 |
1,835,963 |
646,114 |
2,482,077 |
0.61 |
1,114 |
392 |
1506 |
2021 |
2,278,126 |
776,083 |
3,054,209 |
0.65 |
1,482 |
505 |
1987 |
2026 |
2,720,455 |
966,195 |
3,686,650 |
0.70 |
1898 |
674 |
2573 |
2031 |
3,248,668 |
1,201,383 |
4,450,051 |
0.75 |
2,431 |
899 |
3330 |
2041 |
4,423,355 |
1,711,170 |
6,134,525 |
0.86 |
3808 |
1473 |
5281 |
Source: Analysis; Population figures of 2011 and 2021 are from Ghaziabad Master Plan 2021 |
|||||||
Estimate the infrastructure requirement for different SWM Components after adjusting suitable technical options
Input Requirement |
Data Source |
Remarks |
Designing |
Designing | as per norms discussed above |
Primary Collection |
Input Requirement |
Data Source |
Remarks |
Design criteria and selection of technical options |
Guidelines MSW (M&H ) Rules, SWM Manual |
|
Tricycles/mini waste collectors to be used for door do door collection |
Guidelines MSW (M&H ) Rules, SWM Manual |
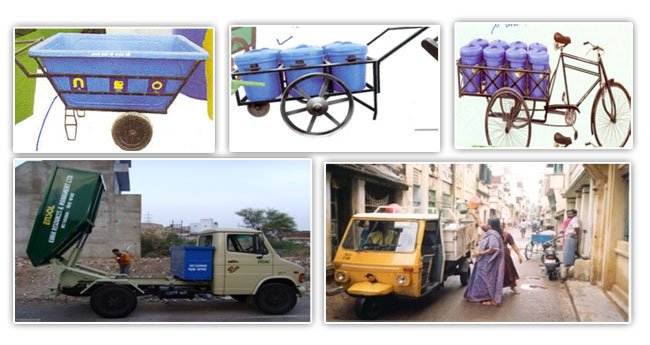
Street sweeping |
Input Requirement |
Data Source |
Remarks |
Design criteria and selection of technical options |
Guidelines MSW (M&H ) Rules, SWM Manual |
|
Sweeping and shallow drain cleaning |
||
Road and drain Network |
||
Manpower |
||
Tools like pushcarts, brooms and other accessories |
Storage and Secondary Collection System |
Input Requirement |
Data Source |
Remarks |
Design criteria and selection of technical options |
Guidelines MSW (M&H ) Rules, SWM Manual |
|
Bins |
||
Location |
||
Capacity |
||
Numbers |
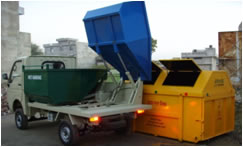
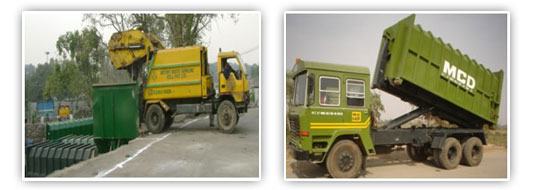
Transport to Transfer Station |
Input Requirement |
Data Source |
Remarks |
Design criteria and selection of technical options |
Guidelines MSW (M&H ) Rules, SWM Manual |
|
Modes (Type of vehicles) |
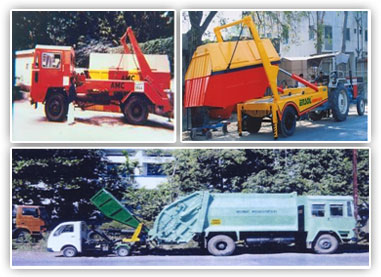
Transfer Station Construction and Management |
Input Requirement |
Data Source |
Remarks |
Design criteria and selection of technical options |
Guidelines MSW (M&H ) Rules, SWM Manual |
|
Location and land Requirement |
||
Type of Transfer station |
||
Equipments |
Processing the Waste (Compost Plant) |
Input Requirement |
Data Source |
Remarks |
Design criteria and selection of technical options |
Guidelines MSW (M&H ) Rules, SWM Manual |
|
Location and land requirement |
||
Plant and machinery |
||
Equipments |
Disposal at SLF Site |
Input Requirement |
Data Source |
Remarks |
Design criteria and selection of technical options |
Guidelines MSW (M&H ) Rules, SWM Manual |
|
Location and land requirement |
||
Plant and machinery |
||
Equipments |